10-Year Yield Breaks Out
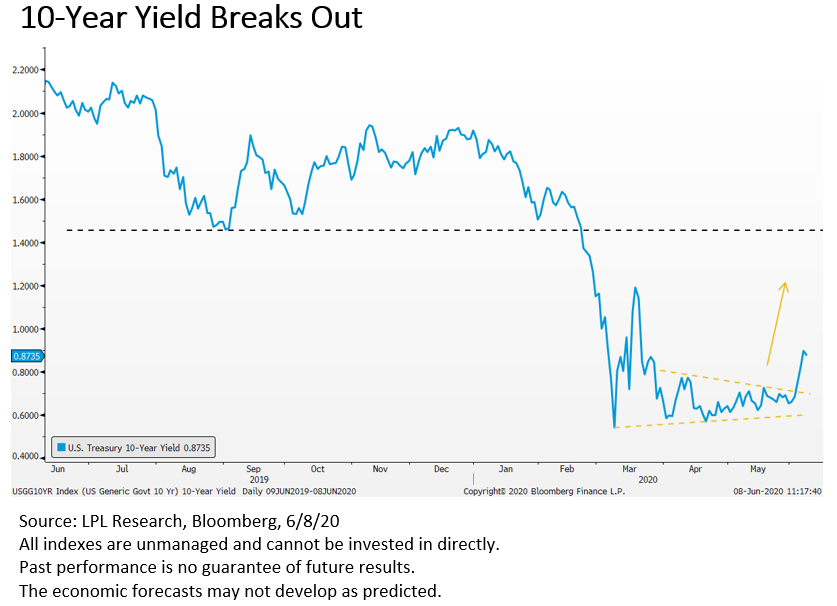
US equities continued to gain ground in May, with the S&P 500 Index advancing an additional 4.5%. However, Treasury yields have been remarkably stable since the equity markets bottomed on March 23, with the 10-year Treasury yield trading in just a 16 basis point range during the entire month of May. That all changed this month, as the benchmark yield broke out of its range, moving 30 basis points higher to 0.96% in the first five trading days of June.
So where can yields go from here? As shown in the LPL Chart of the Day, there may be more room to run before yields run into technical resistance from the 2019 lows. These lows near 1.4% coincide with the previous record lows from 2016, and may represent a tall task for the market to eclipse in 2020. Nevertheless, as of Tuesday’s close (June 9), a move to that level would represent a more than 50 basis point gain, and a significant headwind to fixed income investors already battling low absolute yield levels.

“Continued optimism surrounding the economy reopening, as well as rumors of yield curve controls from the Federal Reserve have likely contributed to the Treasury yields’ move over the past week,” said LPL Financial Senior Market Strategist Ryan Detrick. “We see more upside for yields as we look towards the second half of 2020.”
As we’ve discussed before, yields have historically risen after the Federal Reserve initiates quantitative easing, and while longer-term we believe the likelihood of a significant, sustained move higher is low, it seems the lows for the 10-year Treasury yield may be in for 2020.
IMPORTANT DISCLOSURES
This material is for general information only and is not intended to provide specific advice or recommendations for any individual. There is no assurance that the views or strategies discussed are suitable for all investors or will yield positive outcomes. Investing involves risks including possible loss of principal. Any economic forecasts set forth may not develop as predicted and are subject to change.
References to markets, asset classes, and sectors are generally regarding the corresponding market index. Indexes are unmanaged statistical composites and cannot be invested into directly. Index performance is not indicative of the performance of any investment and do not reflect fees, expenses, or sales charges. All performance referenced is historical and is no guarantee of future results.
Any company names noted herein are for educational purposes only and not an indication of trading intent or a solicitation of their products or services. LPL Financial doesn’t provide research on individual equities. All information is believed to be from reliable sources; however, LPL Financial makes no representation as to its completeness or accuracy.
All index and market data from Factset and MarketWatch.
This Research material was prepared by LPL Financial, LLC.
Securities and advisory services offered through LPL Financial (LPL), a registered investment advisor and broker-dealer (member FINRA/SIPC).
Insurance products are offered through LPL or its licensed affiliates. To the extent you are receiving investment advice from a separately registered independent investment advisor that is not an LPL affiliate, please note LPL makes no representation with respect to such entity.
- Not Insured by FDIC/NCUA or Any Other Government Agency
- Not Bank/Credit Union Guaranteed
- Not Bank/Credit Union Deposits or Obligations
- May Lose Value
For Public Use – Tracking 1- 05020592