5 Charts To See With Stocks At New Highs
“Better late than never.”
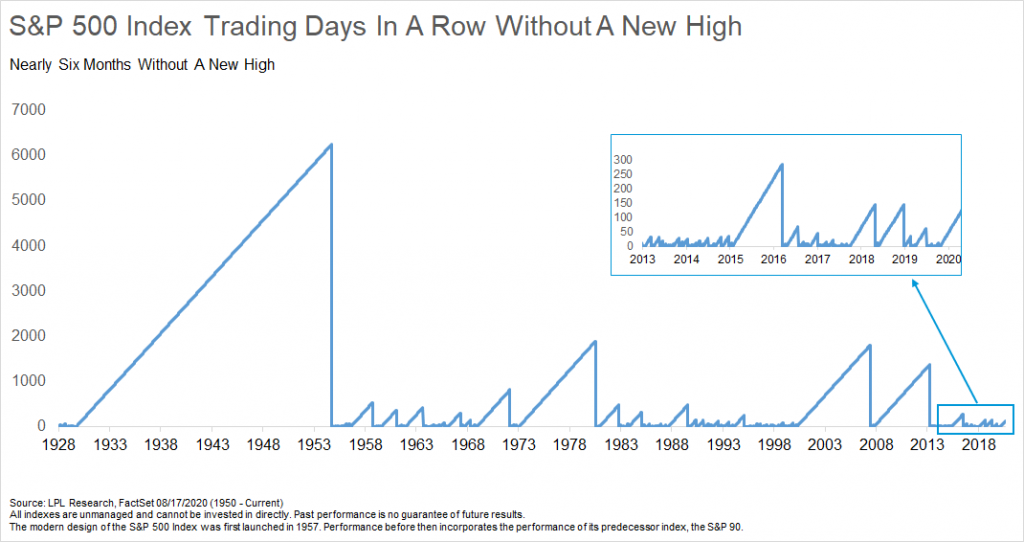
It took a while, but the S&P 500 Index finally made a new all-time high, coming all the way back from the vicious 34% bear market in less than six months.

It might bring back some scary memories, but back in March it took the S&P 500 only 16 days to go from new highs to a bear market (down 20%), the fastest ever.

“This will go down as the fastest bear market ever, but also one of the fastest recoveries ever,” explained LPL Financial Chief Market Strategist Ryan Detrick. “Then again, we’ve never quite seen a recession and recovery like this, so maybe it isn’t a shock to see new highs this quickly.”
The bear officially lasted one month and took five months to recover the losses. Usually when there’s a bear market during a recession, it takes 30 months to recover those loses. This was the third-fastest ever, with only 3 months to recover from a bear market recession in the early ‘80s and 4 months to recover from a bear market in the early ‘90s.

It seems like earlier this year and new highs were a lifetime ago, but the S&P 500 finally moved off unlucky 13, notching the 14th new high of 2020.

As shown in the LPL Chart of the Day, returns after a long time without new highs actually get better. One, three, six, and 12 months after the first new high in more than five months show stronger performance than average or after any new highs. Yet another reason to think that this bull market from a long-term point of view could have some more tricks up its sleeve.

Last, we found there were four other times the S&P 500 made a new high during a recession: In February ’61, July ’80, November ’82, and March ’91. Incredibly, a new expansion started the following month every single time. Could stocks at new highs be signaling an end to this recession? We think that very well could be the case again this time.
IMPORTANT DISCLOSURES
This material is for general information only and is not intended to provide specific advice or recommendations for any individual. There is no assurance that the views or strategies discussed are suitable for all investors or will yield positive outcomes. Investing involves risks including possible loss of principal. Any economic forecasts set forth may not develop as predicted and are subject to change.
References to markets, asset classes, and sectors are generally regarding the corresponding market index. Indexes are unmanaged statistical composites and cannot be invested into directly. Index performance is not indicative of the performance of any investment and do not reflect fees, expenses, or sales charges. All performance referenced is historical and is no guarantee of future results.
Any company names noted herein are for educational purposes only and not an indication of trading intent or a solicitation of their products or services. LPL Financial doesn’t provide research on individual equities. All information is believed to be from reliable sources; however, LPL Financial makes no representation as to its completeness or accuracy.
All index and market data from Factset and MarketWatch.
This Research material was prepared by LPL Financial, LLC.
Securities and advisory services offered through LPL Financial (LPL), a registered investment advisor and broker-dealer (member FINRA/SIPC).
Insurance products are offered through LPL or its licensed affiliates. To the extent you are receiving investment advice from a separately registered independent investment advisor that is not an LPL affiliate, please note LPL makes no representation with respect to such entity.
- Not Insured by FDIC/NCUA or Any Other Government Agency
- Not Bank/Credit Union Guaranteed
- Not Bank/Credit Union Deposits or Obligations
- May Lose Value
For Public Use – Tracking 1-05045962