6 Months From the Low
On March 23, 2020, the S&P 500 Index closed down 2.9% for the day, bringing its total loss from its all-time high to 33.9%. The index was in the midst of its fastest bear market ever. A day earlier, New York Governor Andrew Cuomo had ordered the statewide closure of all non-essential businesses in an effort to slow the spread of the COVID-19 virus, following California’s example and kickstarting a wave of similar lockdowns across states that would ultimately bring the unemployment rate to more than 14%. Although nobody knew it at the time, that day marked the low for the closely watched stock market barometer, and it began a V-shaped recovery. The S&P 500 eclipsed its previous high by mid-August and rose 60% from the March 23 bottom through its most recent high point on September 2.
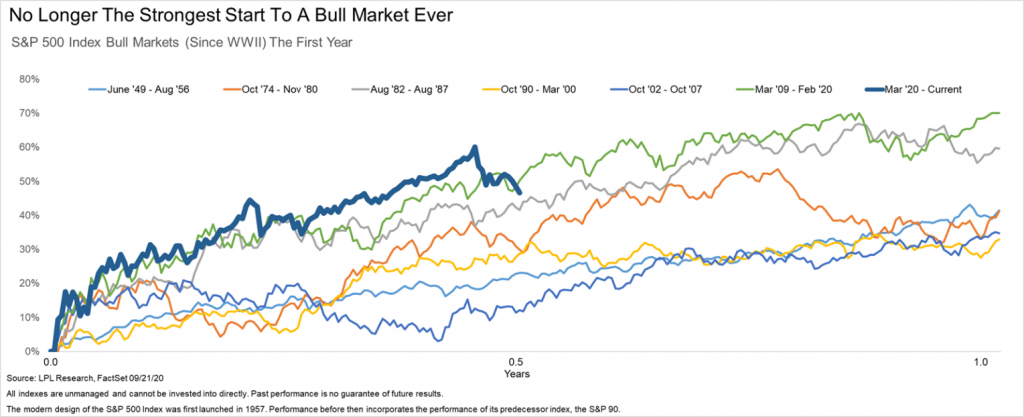
As shown in the LPL Chart of the Day, the S&P 500 was on track for its best six-month start to a bull market ever, but a recent pullback in prices has caused it to fall behind the 2009 financial crisis recovery.

“The economy still has a long way to go to regain pre-pandemic levels of activity,” said LPL Chief Market Strategist Ryan Detrick. “However, even with the recent pullback, the stock market’s recovery has been one of the strongest on record, and investors are clearly looking ahead to better times.”
Having a large allocation to technology and growth companies whose businesses have been more insulated from the negative impacts of the virus certainly has helped the S&P 500. However, we believe it is unfair to say that this recovery has occurred only in those particular types of companies. In fact, through the end of last week, all 11 sectors had gained at least 30% from the lows, and the small and highly cyclical materials sector was the best performing sector during that period, having gained more than 70%. In addition, the Russell 2000 Index, which measures the performance of small cap companies in the United States, was among the worst hit during the February–March bear market, but it has actually outperformed the S&P 500 since the market bottom.
History tells us that the gains may not necessarily be over either. In five of the six instances shown in the chart above, stocks went on to more gains in the next six months, with the only exception a less than 1% loss in months 6–12 of the dot-com bubble recovery. In addition, while the S&P 500 has already made new all-time highs this month, as the chart below shows, other key indexes remain well below all-time highs, potentially leaving plenty of room for upside if the economy continues to recover.

Perhaps most importantly, we do not view the recent pullback in stock prices as investors reassessing the durability of the recovery. Since September 2, credit spreads have remained contained, Treasury yields have held steady, and more economically sensitive areas of the market such as industrials, financials, and even real estate have outperformed large cap growth and the information technology sector. This is the exact opposite of what we saw in February and March. As discussed in our recent Weekly Market Commentary, we have raised our year-end fair value target for the S&P 500 to 3,450–3,500, implying 4–6% upside through 2020.
IMPORTANT DISCLOSURES
This material is for general information only and is not intended to provide specific advice or recommendations for any individual. There is no assurance that the views or strategies discussed are suitable for all investors or will yield positive outcomes. Investing involves risks including possible loss of principal. Any economic forecasts set forth may not develop as predicted and are subject to change.
References to markets, asset classes, and sectors are generally regarding the corresponding market index. Indexes are unmanaged statistical composites and cannot be invested into directly. Index performance is not indicative of the performance of any investment and do not reflect fees, expenses, or sales charges. All performance referenced is historical and is no guarantee of future results.
Any company names noted herein are for educational purposes only and not an indication of trading intent or a solicitation of their products or services. LPL Financial doesn’t provide research on individual equities.
All information is believed to be from reliable sources; however, LPL Financial makes no representation as to its completeness or accuracy.
All index and market data are from FactSet and MarketWatch.
This Research material was prepared by LPL Financial, LLC.
Securities and advisory services offered through LPL Financial (LPL), a registered investment advisor and broker-dealer (member FINRA/SIPC).
Insurance products are offered through LPL or its licensed affiliates. To the extent you are receiving investment advice from a separately registered independent investment advisor that is not an LPL affiliate, please note LPL makes no representation with respect to such entity.
- Not Insured by FDIC/NCUA or Any Other Government Agency
- Not Bank/Credit Union Guaranteed
- Not Bank/Credit Union Deposits or Obligations
- May Lose Value
For Public Use – Tracking 1-05058563