How Stocks Perform in a President’s First Year
2021 kicks off the first year of a new four-year presidential cycle. One of the most popular questions we’ve received lately is how have stocks performed historically during this political year.
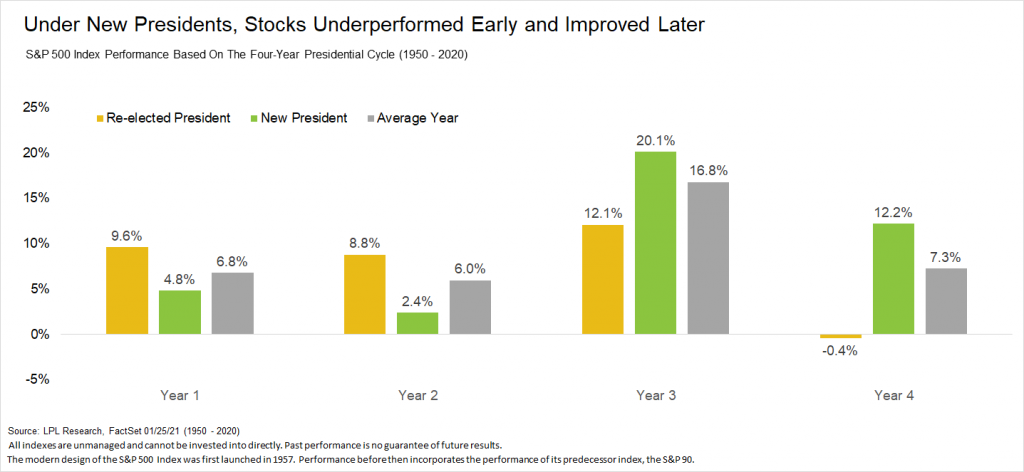
For starters, the S&P 500 Index historically has gained 6.8% per year during the first year of the four-year presidential cycle, but stocks have done better when the president was re-elected than when someone new occupied the White House. This makes sense, as a new president could bring new policies and potential uncertainty. Additionally, stocks do better during years three and four under a new president, while they are much weaker early in the cycle.

As shown in the LPL Chart of the Day, breaking down all the quarters of the four-year presidential cycle shows that the first quarter of the first year in the cycle is one of only two quarters with a negative average return.

Bigger picture, historically the fourth quarter of the year has been the strongest of the year, with the first quarter the second best on average. Don’t forget, the third quarter is usually a weak one. Please note, below is for all years, not just the first year of the cycle.

We will take a closer look at February returns next week on the blog, but it is worth noting that when a new party is in power in the White House, historically stocks have struggled from late January until early March. “It is interesting, but from around the time of the inauguration to several weeks out, stocks tend to be pretty weak,” according to LPL Financial Chief Market Strategist Ryan Detrick. “It may be as simple as new leadership could bring with it new policies and added uncertainty”.

Lastly, please be sure to watch our latest LPL Market Signals podcast, as we discuss positive COVID trends, small caps, and valuations.
IMPORTANT DISCLOSURES
This material is for general information only and is not intended to provide specific advice or recommendations for any individual. There is no assurance that the views or strategies discussed are suitable for all investors or will yield positive outcomes. Investing involves risks including possible loss of principal. Any economic forecasts set forth may not develop as predicted and are subject to change.
References to markets, asset classes, and sectors are generally regarding the corresponding market index. Indexes are unmanaged statistical composites and cannot be invested into directly. Index performance is not indicative of the performance of any investment and do not reflect fees, expenses, or sales charges. All performance referenced is historical and is no guarantee of future results.
Any company names noted herein are for educational purposes only and not an indication of trading intent or a solicitation of their products or services. LPL Financial doesn’t provide research on individual equities. All information is believed to be from reliable sources; however, LPL Financial makes no representation as to its completeness or accuracy.
All index and market data from FactSet and MarketWatch.
This Research material was prepared by LPL Financial, LLC.
Securities and advisory services offered through LPL Financial (LPL), a registered investment advisor and broker-dealer (member FINRA/SIPC).
Insurance products are offered through LPL or its licensed affiliates. To the extent you are receiving investment advice from a separately registered independent investment advisor that is not an LPL affiliate, please note LPL makes no representation with respect to such entity.
- Not Insured by FDIC/NCUA or Any Other Government Agency
- Not Bank/Credit Union Guaranteed
- Not Bank/Credit Union Deposits or Obligations
- May Lose Value
For Public Use – Tracking 1-05104370