
October Market Insights – The October Rebound
U.S. and International Equities
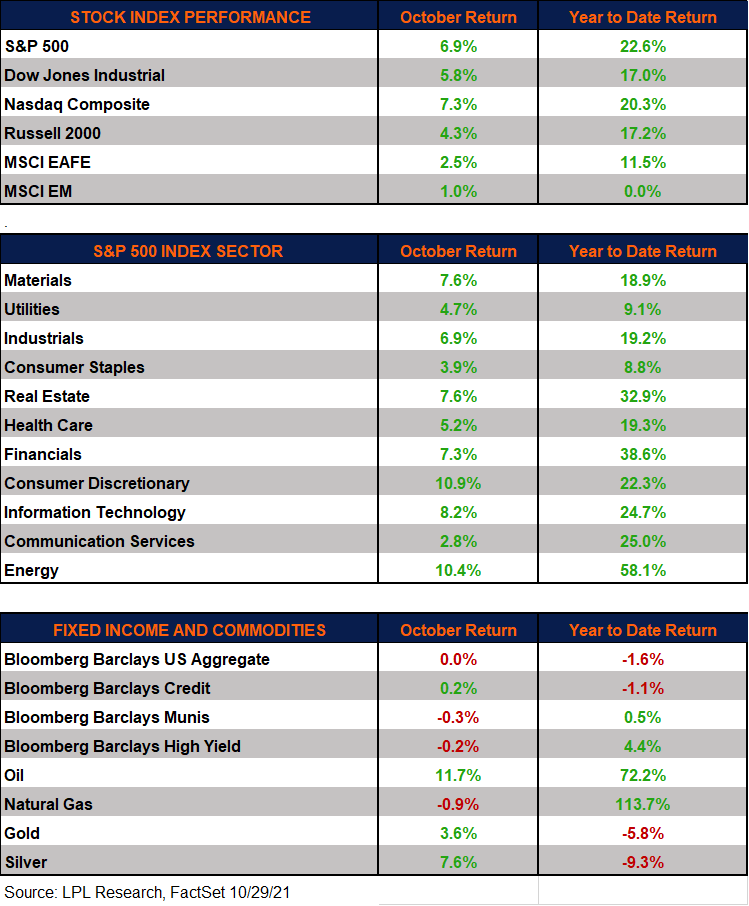
Stocks erased September losses with solid gains in October for the broad market averages. The S&P 500 returned almost 7% for the month, while the Dow Industrials and Nasdaq rose over 5% and 7%, respectively.
The developed international markets (MSCI EAFE) and emerging markets (MSCI EM) stocks also finished the month nicely higher. Despite concerns about China property giant Evergrande’s solvency along with the Chinese regulatory crackdown, EM did quite well as investors took advantage of the summer’s selloff.
Earnings, Earnings, Earnings
With about half of S&P 500 companies having posted their third quarter results, the vast majority of the reports have been better than expected with over 80% of these companies beating estimates by an average of 12% and year-over year earnings growth tracking to 36%. So far, companies have generally successfully navigated the supply chain/labor challenges that many industries are facing.
Second Straight Strong Month for Energy
Energy stocks, which finished lower in both July and August, received increased bids for the second straight month as worries mount over supply shortages, particularly in Europe and China. Energy shortages in China have some investors worried about future Chinese industrial production, dampening investor sentiment for some investments tied to Chinese economy. That being said, consumer discretionary stocks led the month on the back of Tesla as well as a resurgence in consumer spending.
Commodities Solid in October
Both natural gas and oil have had outstanding years so far, gaining over 100% and 70%, respectively. Spot prices reflect an increase in energy demand due to colder weather given both the fall and winter seasons across the country. In addition, as mentioned above, China’s energy crunch helped not only the oil market, but also helped push the price of natural gas higher in October. In addition, some precious metals had a positive October, with silver returning over 7% last month. Concerns about inflation along with higher industrial demand helped some metals gain traction.
Higher Rates Weighed on Fixed Income Returns
The benchmark Bloomberg Barclays U.S. Aggregate Index finished essentially flat for the month. High yield bonds (Bloomberg Barclays High Yield Index), which have been a bright spot this year, also sold off, pushing their yields higher despite their sensitivity to equity market fluctuations. Following the domestic fixed income market, international bonds (FTSE World Government Bond Index) also sold off for the second straight month amid rising interest rates globally.
U.S. Economic Data Recap
Inflation: Consumer prices increased for the seventh straight month in September. The headline Consumer Price Index (CPI) increased to 5.4% on a year-to-year basis, which was more than expected. Removing volatile food and energy prices, the September Core Consumer Price Index increased by 4.0% on a year-to-year basis, which was below economists’ expectations.
The PPI increased over 8% year-over-year again in September, which, according to the Labor Department, was the fastest annual pace since the federal government began calculating PPI. September core producer prices excluding food, energy, and trade services increased 6.8% year over year. That being said, this came in below analyst expectations.
LPL Research continues to believe these inflationary pressures will prove mostly transitory. Looking at September’s CPI, a resurgent Delta variant this summer played a part in supply chain disruptions which contributed to higher inflation. We continue believe future reports will help clarify the magnitude of its effect.
U.S. consumer: The Conference Board’s Consumer Confidence Index declined in September as COVID-19 concerns along with higher inflation (especially rising gas and food prices) weighed on consumer sentiment. Consumer confidence is still relatively high when looking at historical levels, however the Consumer Confidence Index has declined almost 20 points from the June reading of 128.9. In addition, the October University of Michigan consumer sentiment survey fell slightly this month from September as many Americans remain concerned about their economic prospects and rising prices across many consumer markets.
Retail sales: Following August’s solid retail sales reading, September’s retail sales beat economists’ expectations with a 0.7% month-to-month increase. On a year-over-year basis, sales rose almost 14%, slightly lower than August’s year-over-year reading. Total retail sales rose over the past two months and three of the past four months, showing that consumer spending is resilient in the wake of the Delta variant along with supply chain issues.
U.S. home sales: Home sales increased in September and enjoyed their best showing since January. Lower interest rates late this summer along with the work from home initiatives contributed to last month’s growth in home sales. The growth in home resales, which account for the majority of home sales in the country, increased 7% on a year-to-year basis. The median existing home price sold in September came in just under $353,000.
Small business sentiment: The National Federation of Independent Business (NFIB) Small Business Optimism Index declined in September to its lowest reading since March. Unfilled job openings remain an issue with small businesses. In addition, business owners mentioned supply disruptions as another problem. These challenges are not unexpected to clear up right away, as the percentage of owners expecting an improved business climate over the next six months declined to its lowest reading since December 2012.
Federal Reserve (Fed) news: The September Federal Open Market Committee (FOMC) meeting minutes released last month showed that a formal announcement on tapering is likely coming in November. The minutes reported that FOMC members believed that tapering could start in either mid-November or mid-December. Moreover, the Committee remains divided on when interest rate hikes could begin. Some participants believe that it would likely be appropriate to keep the federal funds rate at or near its zero lower bound for the next couple years.
U.S. employment: The U.S. unemployment rate has declined substantially from last year’s peak, but at under 6%, it is still well off full employment levels. Even as the economy reopens and demand for labor improves, labor market supply needs to improve in order for the economy to reach full employment.
Looking ahead
The economic recovery has continued—albeit at a slower pace—even as the battle against COVID-19 and its variants continues. Strong earnings have been an important driver of this year’s strong stock market performance and third quarter earnings have been coming in solid. The ability for companies to successfully absorb higher input costs and pass them onto their consumers will play an important role in future earnings results and also the equity markets amid persistent supply chain challenges.
We continue to believe that inflation is mostly transitory and will stabilize once the economy completes its reopening, when supply chains are fully operational, and labor shortages ease. The mitigation of the Delta variant is going to be important given the tight labor market. Key questions that market participants want answered are how long the “transitory” period will last and what impact that may have on Fed policy, interest rates, economic growth, corporate profits, and stock valuations. Favorable seasonality and a potential pickup in economic growth position stocks to deliver additional gains over the rest of the year, in our view.
IMPORTANT DISCLOSURES
This material is for general information only and is not intended to provide specific advice or recommendations for any individual. There is no assurance that the views or strategies discussed are suitable for all investors or will yield positive outcomes. Investing involves risks including possible loss of principal. Any economic forecasts set forth may not develop as predicted and are subject to change.
References to markets, asset classes, and sectors are generally regarding the corresponding market index. Indexes are unmanaged statistical composites and cannot be invested into directly. Index performance is not indicative of the performance of any investment and do not reflect fees, expenses, or sales charges. All performance referenced is historical and is no guarantee of future results. All market and index data comes from FactSet and MarketWatch.
Any company names noted herein are for educational purposes only and not an indication of trading intent or a solicitation of their products or services. LPL Financial doesn’t provide research on individual equities. All information is believed to be from reliable sources; however, LPL Financial makes no representation as to its completeness or accuracy.
U.S. Treasuries may be considered “safe haven” investments but do carry some degree of risk including interest rate, credit, and market risk. Bonds are subject to market and interest rate risk if sold prior to maturity. Bond values will decline as interest rates rise and bonds are subject to availability and change in price.
For a list of descriptions of the indexes referenced in this publication, please visit our website at lplresearch.com/definitions.
This Research material was prepared by LPL Financial LLC.
Securities and advisory services offered through LPL Financial (LPL), a registered investment advisor and broker-dealer (member FINRA/SIPC).
Insurance products are offered through LPL or its licensed affiliates. To the extent you are receiving investment advice from a separately registered independent investment advisor that is not an LPL affiliate, please note LPL makes no representation with respect to such entity.
- Not Insured by FDIC/NCUA or Any Other Government Agency
- Not Bank/Credit Union Guaranteed
- Not Bank/Credit Union Deposits or Obligations
- May Lose Value
For Public Use – Tracking 1-05207830