What Happens When The Bear Ends?
The incredible rally off the March 23 lows continues for equities, with the S&P 500 Index now up more than 32% in 40 trading days. As impressive as the rally has been, we do have some near-term concerns, as we discussed in Downside Risk Remains. Higher valuations, US-/China relations, weakening technicals, and the historically troublesome summer months all could play a part in potential weakness after the record run.
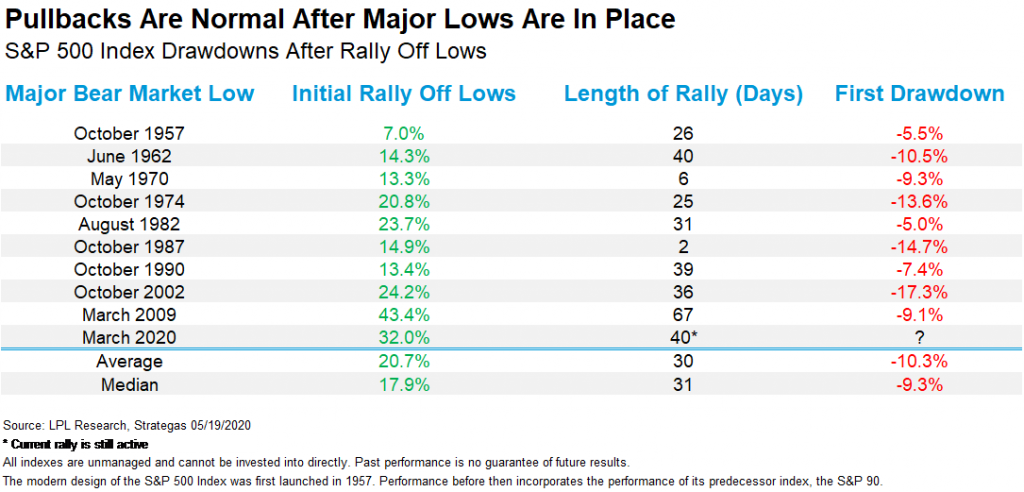
“In 40 trading days, the S&P 500 gained 32%, which is second only to the 40 days off the March 2009 lows,” explained LPL Financial Senior Market Strategist Ryan Detrick. “Looking back at history shows that after the initial surge off of bear lows, stocks tend to correct about 10%, which is something we could see this time around.”
As shown in the LPL Chart of the Day, the S&P 500 rallied nearly 21% in 30 days after all major bear markets. But once those initial rallies ended, there was a correction of more than 10% on average. Bottoms are a process, and as impressive as this run has been, we think the odds are quite high for some type of pullback or correction over the coming months. Thanks to our friends at Strategas Research Partners for the data points below.

For more of our investment insights and thoughts on today’s markets and economy, check out our latest LPL Market Signals podcast How Our Economy Can Bounce Back.
IMPORTANT DISCLOSURES
This material is for general information only and is not intended to provide specific advice or recommendations for any individual. There is no assurance that the views or strategies discussed are suitable for all investors or will yield positive outcomes. Investing involves risks including possible loss of principal. Any economic forecasts set forth may not develop as predicted and are subject to change.
References to markets, asset classes, and sectors are generally regarding the corresponding market index. Indexes are unmanaged statistical composites and cannot be invested into directly. Index performance is not indicative of the performance of any investment and do not reflect fees, expenses, or sales charges. All performance referenced is historical and is no guarantee of future results.
Any company names noted herein are for educational purposes only and not an indication of trading intent or a solicitation of their products or services. LPL Financial doesn’t provide research on individual equities. All information is believed to be from reliable sources; however, LPL Financial makes no representation as to its completeness or accuracy.
This Research material was prepared by LPL Financial, LLC.
Securities and advisory services offered through LPL Financial (LPL), a registered investment advisor and broker-dealer (member FINRA/SIPC).
Insurance products are offered through LPL or its licensed affiliates. To the extent you are receiving investment advice from a separately registered independent investment advisor that is not an LPL affiliate, please note LPL makes no representation with respect to such entity.
- Not Insured by FDIC/NCUA or Any Other Government Agency
- Not Bank/Credit Union Guaranteed
- Not Bank/Credit Union Deposits or Obligations
- May Lose Value
For Public Use – Tracking 1-05013125