What Worked In Q3
Stocks fared well during the third quarter despite September’s weakness, with the S&P 500 Index returning about 9%. The quarterly gain brought the return through the first nine months of the year to 5.6%. Here we peel back the onion on the third quarter’s stock performance to look at what worked and what didn’t.
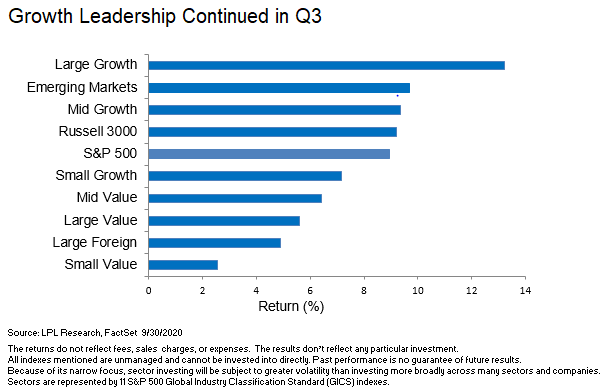
Growth beat value for the quarter despite losing ground in September. The growth style of investing continued its impressive 2020 run during the quarter, shown in the LPL Chart of the Day, but underperformed during September as markets pulled back and rotated some from the winners to the laggards. Value’s outperformance for the month was its first such feat in 12 months, based on the Russell 1000 style indexes. Over the full quarter, growth got a boost from strong gains in technology, while value was hurt by weakness in the energy sector.

“The improving performance of cyclical value stocks in September suggests markets may be increasingly pricing in a durable economic expansion,” said LPL Financial Equity Strategist Jeffrey Buchbinder. “We’re sticking with growth, but as more progress is made on vaccine candidates, value could make a run.”
Small caps held up slightly better than large caps during September but lagged for the quarter. As the US economy transitions from recession to a new expansion, we would expect small caps to do well as traditionally strong early-cycle performers. They did well coming off the March 2020 lows, but performance has leveled off in recent months due to the strength in large cap technology and other stay-at-home stocks.
Strong quarter for emerging markets. Looking at regions, emerging markets stocks outperformed the United States during the third quarter with its 9.7% return, based on the MSCI Emerging Markets (EM) index. EM outperformance was driven by China, South Korea, and Taiwan, as China led the way out of the global pandemic and its technology-driven trading partners in Asia thrived. Developed international stocks lagged during the quarter, based on the MSCI EAFE Index, due to weakness in France and the United Kingdom. Over the first nine months of 2020, emerging markets edged 0.9% lower, while developed international stocks lost 6.7%.
Consumer discretionary topped all equity sectors for the quarter. Gains were broad-based, though homebuilders stood out with outsized gains as the housing market remains quite strong. The internet retailers lagged slightly behind the sector as some of the pandemic winners took a breather late in the quarter. Energy struggled mightily with a nearly 20% decline even though oil and natural gas prices rose, bringing the sector’s 2020 loss to 48% through September 30.

LPL Advisors: For more on recent winners and losers and what asset classes and sectors LPL Research favors heading into the election, look for our Global Portfolio Strategy report October 9.
IMPORTANT DISCLOSURES
This material is for general information only and is not intended to provide specific advice or recommendations for any individual. There is no assurance that the views or strategies discussed are suitable for all investors or will yield positive outcomes. Investing involves risks including possible loss of principal. Any economic forecasts set forth may not develop as predicted and are subject to change.
References to markets, asset classes, and sectors are generally regarding the corresponding market index. Indexes are unmanaged statistical composites and cannot be invested into directly. Index performance is not indicative of the performance of any investment and do not reflect fees, expenses, or sales charges. All performance referenced is historical and is no guarantee of future results.
Any company names noted herein are for educational purposes only and not an indication of trading intent or a solicitation of their products or services. LPL Financial doesn’t provide research on individual equities. All information is believed to be from reliable sources; however, LPL Financial makes no representation as to its completeness or accuracy.
All index and market data from FactSet and MarketWatch.
This Research material was prepared by LPL Financial, LLC.
Securities and advisory services offered through LPL Financial (LPL), a registered investment advisor and broker-dealer (member FINRA/SIPC).
Insurance products are offered through LPL or its licensed affiliates. To the extent you are receiving investment advice from a separately registered independent investment advisor that is not an LPL affiliate, please note LPL makes no representation with respect to such entity.
- Not Insured by FDIC/NCUA or Any Other Government Agency
- Not Bank/Credit Union Guaranteed
- Not Bank/Credit Union Deposits or Obligations
- May Lose Value
For Public Use – Tracking 1-05064476