3 Charts To Watch If You Are Bullish
The S&P 500 Index just closed the door on its best August since 1986, making new all-time highs along the way, while also closing up five months in a row.
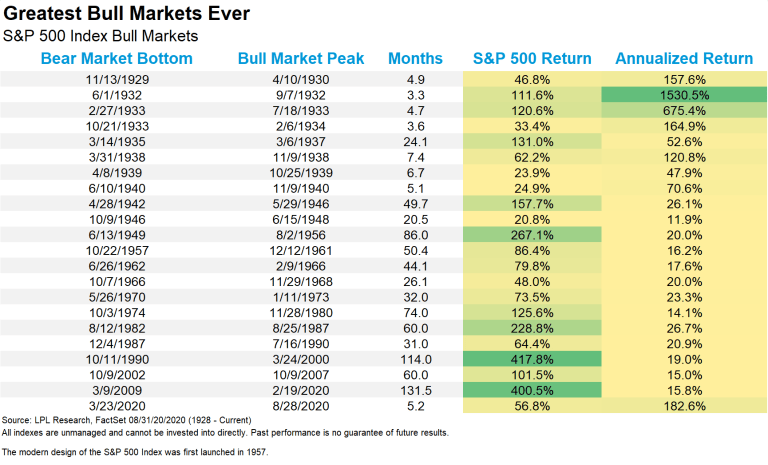
First things first, make no mistake about it; this is a new bull market. That of course doesn’t mean it will last years like previous bull markets, but a nearly 57% gain in 5 months is what we’d classify as a bull market.
Here are all the bull markets going back to the Great Depression and where this one ranks.
Now let’s dig into the 5 month win streak. It is quite rare for stocks to gain from April through August, as the summer months tend to be somewhat tricky. Yet, we found there were six other years that saw these 5 months all close higher and the rest of the year was higher 4 times, with some solid returns in there. In fact, the only year that was lower the rest of the year was 2018, mainly due to the Fed policy mistake in December 2018.

“What might surprise many investors is 5 month win streaks are actually incredibly bullish going forward,” explained LPL Financial Chief Market Strategist Ryan Detrick. “In fact, a year after a 5 month win streak has seen the S&P 500 higher 25 of the past 26 times.”
As shown in the LPL Chart of the Day, the S&P 500 Index gained more than 35% during this 5 month win streak, the most ever. Yet, the future gains after 5 month win streaks is very impressive, higher 25 out of 26 times a year later. An object in motion tends to stay in motion and this sure seems to be the case here.

For more of our investment insights on the record breaking August and what could be on tap in September, check out our latest LPL Market Signals podcast below.
IMPORTANT DISCLOSURES
This material is for general information only and is not intended to provide specific advice or recommendations for any individual. There is no assurance that the views or strategies discussed are suitable for all investors or will yield positive outcomes. Investing involves risks including possible loss of principal. Any economic forecasts set forth may not develop as predicted and are subject to change.
References to markets, asset classes, and sectors are generally regarding the corresponding market index. Indexes are unmanaged statistical composites and cannot be invested into directly. Index performance is not indicative of the performance of any investment and do not reflect fees, expenses, or sales charges. All performance referenced is historical and is no guarantee of future results.
Any company names noted herein are for educational purposes only and not an indication of trading intent or a solicitation of their products or services. LPL Financial doesn’t provide research on individual equities. All information is believed to be from reliable sources; however, LPL Financial makes no representation as to its completeness or accuracy.
All index and market data from FactSet and MarketWatch.
This Research material was prepared by LPL Financial, LLC.
Securities and advisory services offered through LPL Financial (LPL), a registered investment advisor and broker-dealer (member FINRA/SIPC).
Insurance products are offered through LPL or its licensed affiliates. To the extent you are receiving investment advice from a separately registered independent investment advisor that is not an LPL affiliate, please note LPL makes no representation with respect to such entity.
- Not Insured by FDIC/NCUA or Any Other Government Agency
- Not Bank/Credit Union Guaranteed
- Not Bank/Credit Union Deposits or Obligations
- May Lose Value
For Public Use – Tracking 1-05050544