Chart of the Year
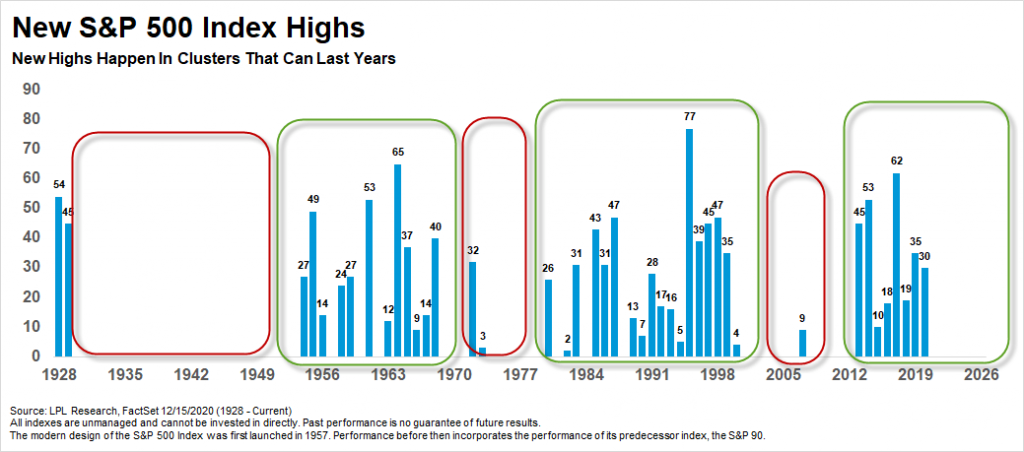
Stocks continue to surprise to the upside, with the Russell 2000 Index (small caps) and the Nasdaq making new all-time highs on Tuesday. The S&P 500 Index, a chip shot from new highs, already has made 30 new highs so far this year. “One thing that surprises many investors is new highs happen in clusters that can last a decade or more,” explained LPL Financial Chief Market Strategist Ryan Detrick. “Given that this cluster of new highs is only seven years old, history would suggest that we don’t bet against several more years of new highs.”

One of the more amazing charts (and our friend Sam Ro at Yahoo! Finance called this the chart of the year) is how this new bull market has tracked the 2009 bull market. We’ve been sharing this chart for months now, noting if things continued to track 2009, then significant gains could be in store and sure enough that has played out. Here’s the catch, continued strength could still be in store, as 2009 continued to gain the next few months from this point forward.

Lastly, will Santa come in December? We discussed this in detail at the start of the month in Big Gains Steal From Santa, but the truth of the matter is the S&P 500 Index is flat on average half way through the month and nearly all of the impressive December gains take place the second half of the month.
As shown in the LPL Chart of the Day, if Santa is going to come in 2020, now is the time for the reindeer to get ready and for stocks to potentially bounce.

For more of our thoughts on a Santa Claus rally, please watch our latest LPL Market Signals podcast from our YouTube channel below.
IMPORTANT DISCLOSURES
This material is for general information only and is not intended to provide specific advice or recommendations for any individual. There is no assurance that the views or strategies discussed are suitable for all investors or will yield positive outcomes. Investing involves risks including possible loss of principal. Any economic forecasts set forth may not develop as predicted and are subject to change.
References to markets, asset classes, and sectors are generally regarding the corresponding market index. Indexes are unmanaged statistical composites and cannot be invested into directly. Index performance is not indicative of the performance of any investment and do not reflect fees, expenses, or sales charges. All performance referenced is historical and is no guarantee of future results.
Any company names noted herein are for educational purposes only and not an indication of trading intent or a solicitation of their products or services. LPL Financial doesn’t provide research on individual equities. All information is believed to be from reliable sources; however, LPL Financial makes no representation as to its completeness or accuracy.
All index and market data from FactSet and MarketWatch.
This Research material was prepared by LPL Financial, LLC.
Securities and advisory services offered through LPL Financial (LPL), a registered investment advisor and broker-dealer (member FINRA/SIPC).
Insurance products are offered through LPL or its licensed affiliates. To the extent you are receiving investment advice from a separately registered independent investment advisor that is not an LPL affiliate, please note LPL makes no representation with respect to such entity.
- Not Insured by FDIC/NCUA or Any Other Government Agency
- Not Bank/Credit Union Guaranteed
- Not Bank/Credit Union Deposits or Obligations
- May Lose Value
For Public Use – Tracking 1-05090165