Housing Data Continues to Surge
For many economic data series, 2020 has been a roller coaster. Not for housing, however. The onset of the COVID-19 pandemic and social distancing measures jump-started the “nesting” behavioral shift away from urban apartments and into single-family housing in the suburbs, as households sought additional space.
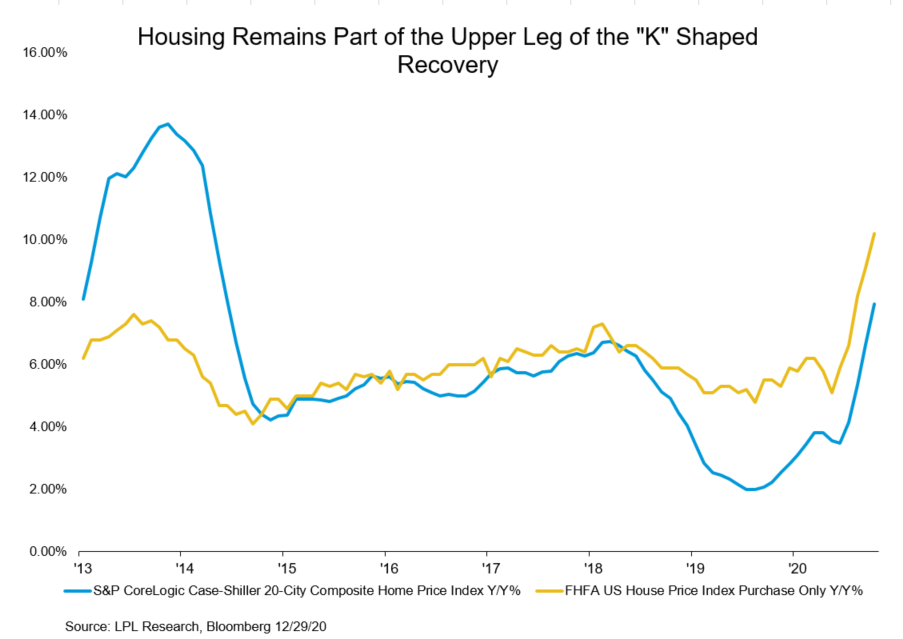
As shown in the LPL Chart of the Day, the S&P CoreLogic Case-Shiller 20-City Composite rose 7.95% year over year (Y/Y) in October, marking the strongest y/y gain since 2014. A similar metric, surveyed by the Federal Housing Finance Agency, confirms the strong rise in home prices.

Nearly all of the 20 cities reported increases in home prices (although data from Detroit is delayed due to the pandemic), indicating prices are rising across the nation. The behavioral shift has also benefited from cyclical tailwinds like low inventories, historically low mortgage rates, and demographic forces, which have emboldened sellers to raise asking prices.
“It’s been remarkable to see that even during the height of the economic downturn, housing data has remained robust,” noted LPL Chief Market Strategist Ryan Detrick. “While the equity market has been more volatile, this data has underpinned the strength we’ve seen from homebuilders and materials stocks.”
While we don’t expect any near-term reversals of the health of the housing market, it wouldn’t be surprising for momentum to fade as the underlying data continues to set a high watermark for additional gains. Further, as the rollout of the approved COVID-19 vaccines continues, this may also begin to ease some of the behavioral pressure that has lifted demand for single-family housing.
IMPORTANT DISCLOSURES
This material is for general information only and is not intended to provide specific advice or recommendations for any individual. There is no assurance that the views or strategies discussed are suitable for all investors or will yield positive outcomes. Investing involves risks including possible loss of principal. Any economic forecasts set forth may not develop as predicted and are subject to change.
References to markets, asset classes, and sectors are generally regarding the corresponding market index. Indexes are unmanaged statistical composites and cannot be invested into directly. Index performance is not indicative of the performance of any investment and do not reflect fees, expenses, or sales charges. All performance referenced is historical and is no guarantee of future results.
Any company names noted herein are for educational purposes only and not an indication of trading intent or a solicitation of their products or services. LPL Financial doesn’t provide research on individual equities. All information is believed to be from reliable sources; however, LPL Financial makes no representation as to its completeness or accuracy.
All index and market data from FactSet and Bloomberg.
This Research material was prepared by LPL Financial, LLC.
Securities and advisory services offered through LPL Financial (LPL), a registered investment advisor and broker-dealer (member FINRA/SIPC).
Insurance products are offered through LPL or its licensed affiliates. To the extent you are receiving investment advice from a separately registered independent investment advisor that is not an LPL affiliate, please note LPL makes no representation with respect to such entity.
- Not Insured by FDIC/NCUA or Any Other Government Agency
- Not Bank/Credit Union Guaranteed
- Not Bank/Credit Union Deposits or Obligations
- May Lose Value
For Public Use – Tracking 1-05093978