Four Reasons The Future Looks Bright For The Bulls
“I look to the future because that’s where I’m going to spend the rest of my life.” George Burns
The bull market continues, with the S&P 500 Index now up more than 10% in 2021. With stocks up more than 80% from the March 2020 lows, the reality is a well-deserved break or consolidation could happen at any time. Looking to the future, as George Burns said above, we would be a buyer of any material weakness, as we believe this bull market is alive and well as we’ll discuss more in this blog.
Here are four bullish stats we’ve found recently that indeed suggest this bull market could still have plenty of life left.
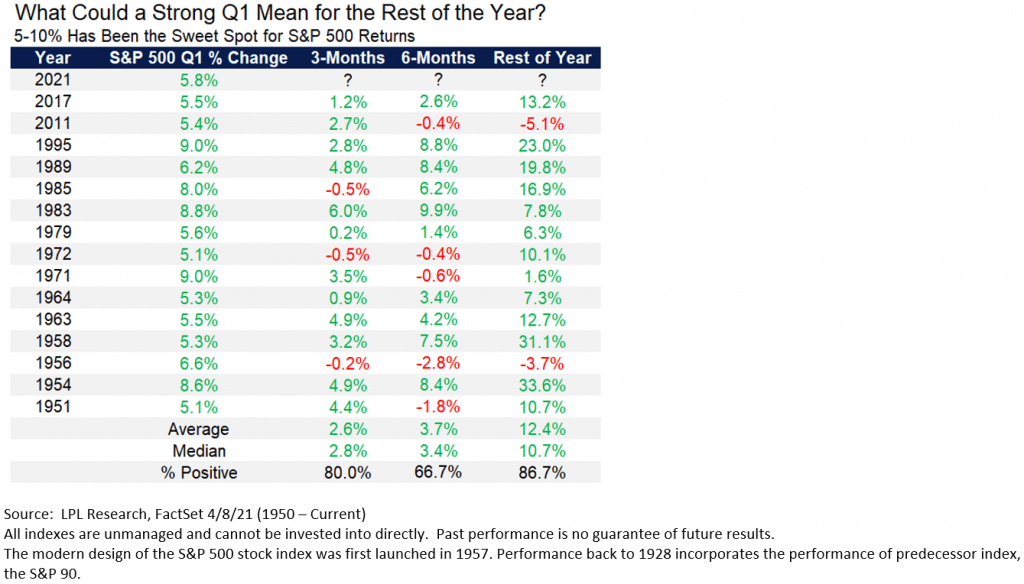
First, the S&P 500 Index was up just under 6% in the first quarter, an area we’d call the sweet spot. Looking back since 1950, when the S&P 500 was up between 5-10% in the first quarter, the rest of the year (so the final three quarters) gained another 12.4% on average and was higher 86.7% of the time. Compare this to when the S&P 500 was up >10% in the first quarter and the returns drop to 6.5% the rest of the year. Lastly, if the first quarter was negative, then the rest of the year was up only 3%. Sweet spot indeed.

Second, the December Low Indicator has bulls smiling. This was created by Lucien Hooper, a Forbes columnist in the 1970s, and it simply says that if the S&P 500 closes beneath the December low during the first quarter then future weakness could be in the cards. But if this critical level holds, then higher prices could be around the corner.
As the LPL Chart of the Day shows, stocks held above the December lows in 2021 and this could mean continued higher prices, as the S&P 500 was up more than 18% on average previous years when this level held and incredibly was higher 33 out of 35 years.

Third, the S&P 500 was up nearly 54% in the 12 months ending March 2021, one of the largest yearly gains ever. Looking at previous times that had significant 12-month returns shows the potential for weak returns 1, 3, and 6 months later. This makes sense, as stocks could need some time to catch their breath. The good news? One year later the S&P 500 was higher more than 90% of the time, with only the year after the 1987 crash in the red. “It might seem counterintuitive to most investors, but big rallies like we’ve seen tend to mark the start of bull markets, not the end, so we wouldn’t bet on this bull market ending anytime soon,” explained LPL Financial Chief Market Strategist Ryan Detrick.

Lastly, overall market breadth is extremely strong. Again, this could suggest near-term there could be an exhaustion point, but this isn’t what you see at the end of bull markets, in fact, it tends to usually happen at the start of new bull markets. Currently, more than 95% of the components in the S&P 500 are above their 200-day moving average, a level only seen two other times, in December 2003 and September 2009. Looking back at 2004 and 2010, 2004 saw consolidation a good part of the year, while 2010 had a well-deserved 16% correction after the huge gains off the March 2009 lows. But the key point is after extreme market breadth like we are seeing now, overall higher prices and the bull market lasted for many more years.

Looking to the future, as George Burns said, we believe it could be a bright one for equity investors, particularly when we consider the return potential for stocks compared to cash and high-quality bonds.
IMPORTANT DISCLOSURES
This material is for general information only and is not intended to provide specific advice or recommendations for any individual. There is no assurance that the views or strategies discussed are suitable for all investors or will yield positive outcomes. Investing involves risks including possible loss of principal. Any economic forecasts set forth may not develop as predicted and are subject to change.
References to markets, asset classes, and sectors are generally regarding the corresponding market index. Indexes are unmanaged statistical composites and cannot be invested into directly. Index performance is not indicative of the performance of any investment and do not reflect fees, expenses, or sales charges. All performance referenced is historical and is no guarantee of future results.
Any company names noted herein are for educational purposes only and not an indication of trading intent or a solicitation of their products or services. LPL Financial doesn’t provide research on individual equities. All information is believed to be from reliable sources; however, LPL Financial makes no representation as to its completeness or accuracy.
All index and market data from FactSet and MarketWatch.
This Research material was prepared by LPL Financial, LLC.
Securities and advisory services offered through LPL Financial (LPL), a registered investment advisor and broker-dealer (member FINRA/SIPC).
Insurance products are offered through LPL or its licensed affiliates. To the extent you are receiving investment advice from a separately registered independent investment advisor that is not an LPL affiliate, please note LPL makes no representation with respect to such entity.
- Not Insured by FDIC/NCUA or Any Other Government Agency
- Not Bank/Credit Union Guaranteed
- Not Bank/Credit Union Deposits or Obligations
- May Lose Value
For Public Use – Tracking # 1- 05133419