
Inflation Concerns Influence Market Results
U.S. and International Equities
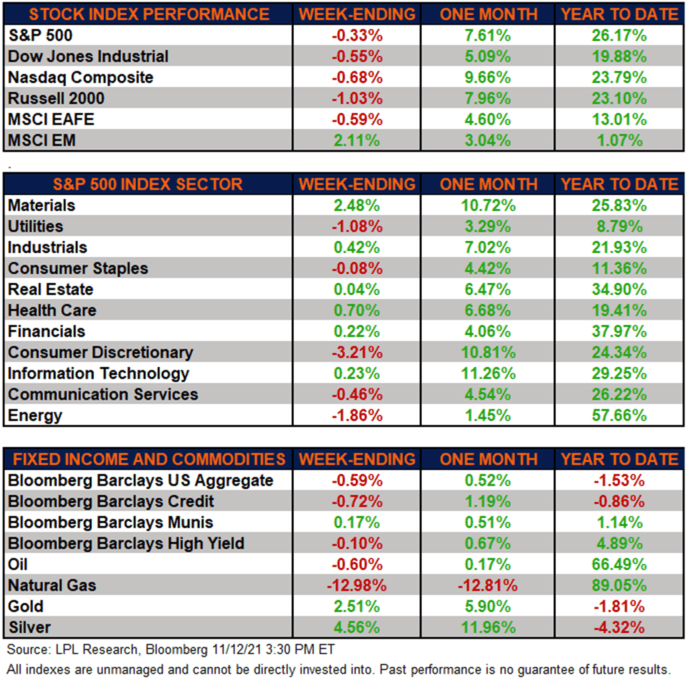
Major Markets Mostly Higher
The major equity markets finished the week on a negative note as inflation worries played a role in investors’ minds amid an excellent Q3 earning season that has almost concluded. Emerging markets (MSCI EM) was the major bright spot, finishing the week higher. As concerns mount over China, investors bought shares on the cheap as emerging markets have been one of the worst performers this year.
Markets Resilient
Without a doubt, both 2020 and 2021 have been quite challenging in the face of the global COVID-19 pandemic, with on-going supply chain disruptions a noticeable consequence. Even with virus-related uncertainty, the S&P 500 has performed extremely well this year.
The S&P 500 Index this week reached an 8-day consecutive all-time high streak, which was the first time this has happened since 1997. In addition, the S&P 500 Index had been higher 17 out of 19 days for the first time since 1971. So far this year, the S&P 500 reached 65 all new highs, which ties it for the all-time second most in a year.
Bonds Reverse Course
The Bloomberg Barclays Aggregate Bond Index finished lower as yields increased, breaking two straight week of gains for the index on inflation concerns. Moreover, high-yield corporate bonds, as tracked by the Bloomberg Barclays High Yield index, sold off, reversing three straight weeks of gains.
Commodities Finish Mixed
Natural gas prices pulled back this week after going strong for two consecutive weeks as market participants took advantage of positive supply-demand fundamentals. Oil has now declined for three straight weeks as weekly inventory data showed more supply build than anticipated. Both gold and silver finished higher for the second consecutive week.
Economic Weekly Roundup
Global PMI Shows Expansion
The Global Purchasing Manager’s Index (PMI) for October levelled off but remains very solidly in expansionary territory. The Eurozone’s reading came in particularly strong, with the highest readings coming from Italy, Ireland, and Scandinavia. This being said, the PMI index has fallen three straight months to a nine-month low. In addition, the U.S. reading came in quite strong; however, it has fallen three straight months and is presently at a year-to-date low.
Consumer Prices Rise More Than Expected
The Consumer Price Index (CPI) climbed almost 1% month over month, and over .5% excluding volatile food and energy prices. This topped economists’ consensus expectations. The one-year increase in CPI, at over 6%, is the highest since 1990. This reading reflects on-going supply challenges in the face of strong demand, an increase in energy prices, and a rebound in some prices that had been dampened by the Delta variant surge.
Small Business Optimism Wanes
The National Federation of Independent Businesses’ Small Business Optimism Index declined in October to a seven-month low. In addition, expectations of business conditions over the next six months fell to its lowest level since 2012. Despite solid demand, the roadblocks of tight labor markets, supply chain disruptions, and rising prices are making it a challenging environment to conduct commerce. This being said, the October jobs report suggests that tight labor markets could show improvement, but supply chains and inflation could be a challenge into the next year.
The following economic data is slated to be released during the week ahead:
- Tuesday: October Export/Import price index, October retail sales, capacity utilization, industrial production, manufacturing production, September business inventories, and National Association of Home Builders (NAHB) housing market index
- Wednesday: October building permits and housing starts
- Thursday: Weekly initial and continuing unemployment claims, October leading indicators
IMPORTANT DISCLOSURES
This material is for general information only and is not intended to provide specific advice or recommendations for any individual. There is no assurance that the views or strategies discussed are suitable for all investors or will yield positive outcomes. Investing involves risks including possible loss of principal. Any economic forecasts set forth may not develop as predicted and are subject to change.
References to markets, asset classes, and sectors are generally regarding the corresponding market index. Indexes are unmanaged statistical composites and cannot be invested into directly. Index performance is not indicative of the performance of any investment and do not reflect fees, expenses, or sales charges. All performance referenced is historical and is no guarantee of future results. All market and index data comes from FactSet and MarketWatch.
Any company names noted herein are for educational purposes only and not an indication of trading intent or a solicitation of their products or services. LPL Financial doesn’t provide research on individual equities. All information is believed to be from reliable sources; however, LPL Financial makes no representation as to its completeness or accuracy.
U.S. Treasuries may be considered “safe haven” investments but do carry some degree of risk including interest rate, credit, and market risk. Bonds are subject to market and interest rate risk if sold prior to maturity. Bond values will decline as interest rates rise and bonds are subject to availability and change in price.
For a list of descriptions of the indexes referenced in this publication, please visit our website at lplresearch.com/definitions.
This Research material was prepared by LPL Financial LLC.
Securities and advisory services offered through LPL Financial (LPL), a registered investment advisor and broker-dealer (member FINRA/SIPC).
Insurance products are offered through LPL or its licensed affiliates. To the extent you are receiving investment advice from a separately registered independent investment advisor that is not an LPL affiliate, please note LPL makes no representation with respect to such entity.
- Not Insured by FDIC/NCUA or Any Other Government Agency
- Not Bank/Credit Union Guaranteed
- Not Bank/Credit Union Deposits or Obligations
- May Lose Value
For Public Use – Tracking # 1-05212683